Introduction to Health Impact Assessment
Introduction to Economic Evaluation

Economic evaluation can be useful to analyze any situation where we want to know if the resources invested on a program or intervention are justified by the results. In most studies, investments are measured by the costs of the intervention in monetary units (dollars), while the outcomes can be measured in various different ways. Below we give a somewhat detailed description of cost-effectiveness analysis (CEA) and brief overviews of two other approaches that address some of the limitations of CEA.
1. Cost Effectiveness Analysis (CEA)
CEA is the most common method used in economic evaluation. CEA and all other methods described here always require a comparison between at least two alternatives, one of which can be the status quo. For example, we may be interested in the consequences of a new policy mandating healthy lunch menus in all public schools. In this case, we would compare the costs and outcomes under the new policy to the current costs and outcomes.
As its name implies, a CEA first requires estimating the net costs of the program or intervention. That is, we want to know how much we would need to invest beyond what we are currently investing if we wanted to implement the new policy. In some cases, if the policy is cheaper than the status quo or if its health benefits lead to lower costs (for example, by preventing treatment costs in the future) the new alternative could be cost-saving. This is not usually the case, though, not even in public health, but that does not imply that the new alternative is not cost-effective. This is a key and often-misunderstood issue in health economics: programs can be cost-effective even if they do not save money.
The second piece of a CEA is the estimation of effectiveness. That is, comparing the health outcomes of all the alternatives being compared. In a CEA we use natural health outcomes; that is, outcomes that are commonly used by healthcare professionals or policymakers when discussing the relevant health area. In the example described above, we would focus on health outcomes that could be affected by school lunch menus, such as obesity or diabetes. Outcomes under the status quo or alternatives that have been implemented before can often be estimated from surveillance, administrative, or survey data. Then, we need to project what those outcomes would be under the alternative(s) not yet in place. This is usually the most critical and complex part of a CEA, where we need to figure out how to use available data and quantitative tools (e.g., statistics, econometrics, and simulation models) to generate unbiased and accurate projections. (By the way, the calculation of these what-if outcomes can also be important to estimate cost-savings!).
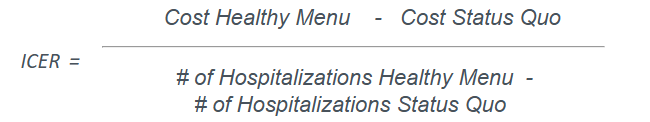
Once we have estimated the costs and outcomes of all alternatives, reporting the results of a CEA is fairly simple. In most cases, we use the incremental cost-effectiveness ratio (ICER), which is a division where we have net (or incremental) costs in the numerator and incremental outcomes in the denominator:

Another option could be:
This highlights what is perhaps the most important limitation of CEA studies: each ICER can only summarize the results using one health outcome so we either need to choose one single outcome to assess the results, or look at several ICERs, which could not always have consistent implications.
Regardless, once we have chosen the health outcome or outcomes we want to look at, our final result looks like this: (all numbers are made up!)
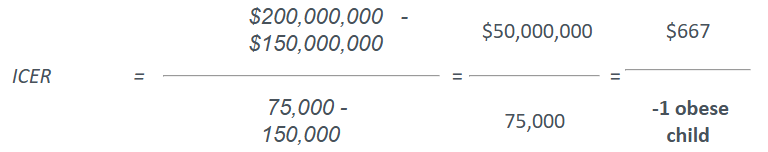
That is, implementing the healthy school lunch menu policy will result in $50 million in additional costs (healthy food is often more expensive and we may need to switch food providers) and 75,000 fewer obese children. (If it helps, you can assume that these numbers are for a single cohort of children, starting in Kindergarten and until they graduate from high school). The last calculation on the right side makes it easier for us to interpret these results: on average, we would spend $667.00 to prevent one case of childhood obesity.
Now the main question everyone should ask: is the investment worth the results? CEA (or the Center for Health Impact Evaluation!) does not usually answer that question. It is up to decision makers to determine whether preventing one case of obesity is worth spending $667. (Always keep in mind: $667 invested here could be invested somewhere else and perhaps yield better results!) In addition to this assessment, many other factors outside the scope of our analysis usually need to be taken into account. Some examples are: does Los Angeles County have sufficient resources to help school districts implement the program now and sustain it in the future? Will there be opposition by some stakeholders (e.g., parents, teachers, food providers)? Can this be approved locally or will it need legislation in Sacramento, or even DC? Are there other ongoing or planned efforts that could interfere or duplicate the benefits of this intervention?
We briefly discussed the main limitation of a CEA but there are certainly good reasons to use this approach. First, it is a relatively straightforward tool that provides easy-to-understand information on the costs and health benefits of a new program or intervention. Because dollars and natural health outcomes are easy to understand, decision makers can concentrate on assessing whether the extra cost is worth the results, rather than trying to interpret concepts not familiar to them (as in CUA, described below). Finally, in those occasional situations where the alternative being studied is cost-saving and has better health outcomes, CEA makes it very easy to understand that the decision may be a no-brainer.
2. Cost Utility Analysis (CUA)
One of the major limitations of CEA is that the ICER can only be calculated for one health outcome (e.g., number of infections, hospitalizations, or deaths) at a time. This can be problematic for at least two reasons:
- Many public health efforts affect several outcomes and sometimes it can be difficult to decide which of them provides the best measure of impact.
- When comparing alternatives that affect different types of health outcomes, it may not be clear how to assess their relative value.
A simple example can help understand both of these issues. Imagine DPH has $1 million that can be invested in any of its programmatic areas and the Center for Health Impact Evaluation is asked to do CEAs of several proposals. The final decision comes to two interventions: one that can prevent 10,000 cases of foodborne illness and another that can increase Tdap immunization among children entering 7th grade by 5,000 vaccinations. Our ICER estimates are $100/foodborne illness case prevented for the first alternative and $200/additional child vaccinated for the second. Not only are these outcomes difficult to compare, the ICERs obscure down-the-road consequences that we would like to take into account: foodborne illness can lead to severe outcomes like hospitalizations or even death, just as becoming infected by diphtheria or pertussis can have its own severe consequences.
In a cost-utility analysis, instead of having to choose one health outcome to estimate the ICER, we use quality of life (QoL) measures, which summarize several health outcomes (physical and mental) into a single number. There are different ways to obtain these measures (a common choice are quality-adjusted life years, or QALYs) but what they all have in common is that they seek to capture the overall health status of a person.
We will not go into the details of CUA here. You can find links to websites with more detailed descriptions of CUA and QALYs in the External Resources page.
3. Cost-Benefit Analysis (CBA)
In many cases, CUA can provide a clearer picture of the health impact of public health interventions than CEA. (Not everyone agrees, though, quality-of-life measures do have limitations and critics.) However, even if we assume that QoL indicators are valid measures of overall health status, their use in CUA does not solve every problem. In particular, two issues remain when using CUA:
- How do we assess the value of quality of life relative to the costs of an intervention?
- How do we compare the value of health interventions to the value of interventions in other public sectors?
The first of these two issues was already highlighted above, just as it is not straightforward to decide whether preventing one case of childhood obesity is worth an investment of $667, it is not clear what the economic value of a quality-adjusted life year is. So, CUA can help summarize the overall health impact of a program, but it is still up to the decision maker to decide whether the cost per QALY gained represents a good value.
The second problem is less commonly faced by decision makers but is still worth explaining. Let’s now say that Los Angeles County has $10 million to spend and the choice has come to between a public health intervention that can save 100 lives each year and a tax subsidy for small businesses that could create 2,000 new jobs. Even if we could estimate the health benefits of these new jobs, many other economic impacts would not be captured by health or QoL measures. The only way to compare these two alternatives is to translate the consequences of the public health intervention into the same units used to measure the impact of tax subsidies: dollars.
In a cost-benefit analysis, both the costs and benefits of a program (in health or any other sector) are estimated in monetary units. The key result in a CBA is the net benefit of the intervention: the $ value of its benefits minus the $ value of its costs. This leads to a clear decision rule: if net benefit > $0, the program is worth the investment, whereas it should not be implemented if net benefit < $0. When comparing two alternative programs, the one with higher net benefit is usually preferred. (Although we should be careful when one alternative requires significantly larger investments than the other.) It should not be difficult to realize that, if everything is expressed in dollars, it does not really matter if we are comparing interventions with completely different outcomes. Whether the outcome is health, jobs, or affordable housing, we will usually prefer the highest net benefit.
Some of the references in the External Resources page explain how the monetary value of health outcomes can be estimated; suffice it to say that these methods are complex and require significant time and effort to be implemented. In addition, not all audiences are receptive to CBAs because they require assigning dollar values to potentially sensitive outcomes, such as lives, disabilities, or sexually transmitted diseases.
In general, the Center for Health Impact Evaluation will recommend evaluations using cost-effectiveness analysis (or, when appropriate, another type of study such as Health Impact Assessments). Of course, every situation is different and we will make sure to discuss which analysis better answers the questions you and your stakeholders may ask.